

Latest work on the global markets for Fintec Group
WHAT A DIFFERENCE A WEEK MAKES
Here are some random observations before we get into today’s analysis:
- Changes are abound in the markets – at least for a week.
- We saw a sharp turn in fortunes in equities – from last Fridays’ post-jobs numbers sell-off to this Friday’s morning’s growing overbought condition. Most of that rally appears to have been related to optimisim of continued dovish behavior by the US Federal Reserve. That idea was further strengthened following the release of the FOMC’s meeting minutes on Thursday.
- We saw other trends being reversed / nearly reversed this week – namely in sugar, coffee and wheat. Meanwhile, others remained in place – such as with soybeans and soybean meal.
- Only time will tell whether the rally in stocks will hold and whether these trend changes take hold. For now, let the technicals act as an alert to the potential changes in longer-term direction.
- Let’s go to the charts for more info on where things may be headed….Have a great weekend!
S&P futures post a torrid win streak since last Friday’s employment report
Recap of last week’s thoughts on the S&P e-Mini Futures:
- The S&P futures were testing support at 1885 when we wrote last week’s report.
- We recommended selling any rally to 1954 and using a close above 1960 as a stop-loss trigger.
Here’s an updated chart of the S&P e-Mini Futures:
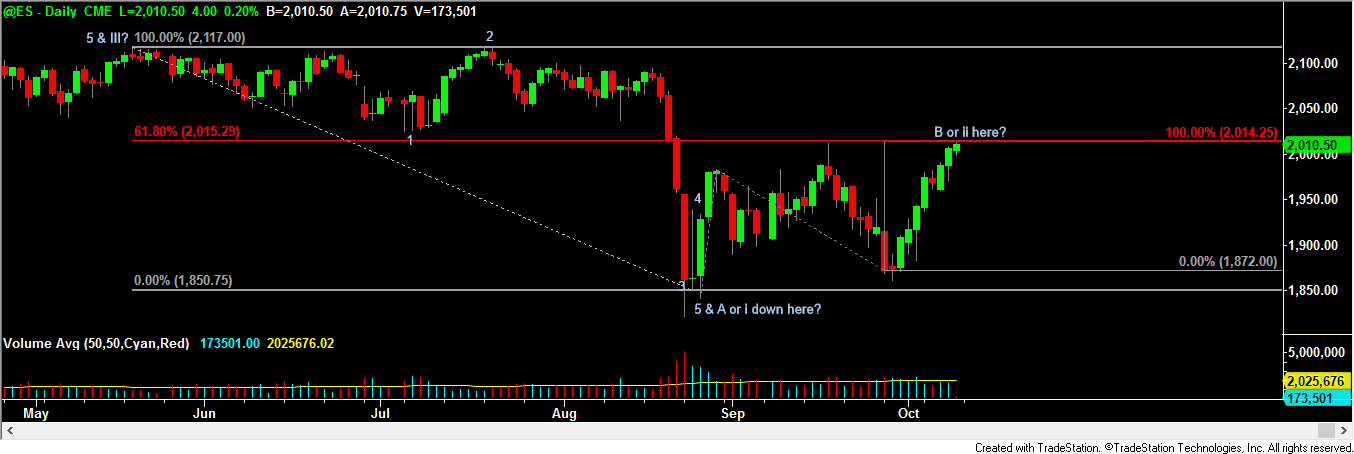
Stocks started to rally, withstood any bearish challenges and continued their upside bias into the weekend this week.
As the chart above shows, there appears to be some important resistance in the 2015 – 2021 range for the S&P futures. That level is merely 0.5% above the trading levels at midday on Friday.
From our perch, there appear to be two possible scenarios for traders to consider – one bearish and one more bullish:
- In the bearish scenario, the market rally stops at 2015 or so and then a move down to around 1760 commences. Given the current momentum in the markets, that would be a real surprise.
- In the more bullish of the two scenarios, the market bottomed at the 9/29/15 intraday low and the rally we’ve seen since then has been the first part of a new, larger up move. Even in that situation, though, it appears that things may have topped out short-term near 2015 and a pullback to 1955, 1938 or 1921 (all Fibonacci retracement lines) is certainly in order.
We would be selling longs and considering shorts near 2015 with stops in place on any close above 2021. The downside target for traders will be 1956 (to be conservative).
We might consider new longs at any of the Fiboancci retracement levels depending on the trading pattern that leads to a test of those levels.
Gold bouncing on perception of Fed dovishness
Recap of last week’s thoughts on gold:
- Gold futures turned lower and appeared to be headed down to at least a test of 1086.
- We speculated that the support level would fail to hold up and that 1021 and/or 984 would eventually come into play for gold.
- We noted that we would be using any bounce in gold up to 1155 to initiate short positions. We would honor stops on a close above 1157 and will have as our target 1021.
Here’s an updated chart of gold:
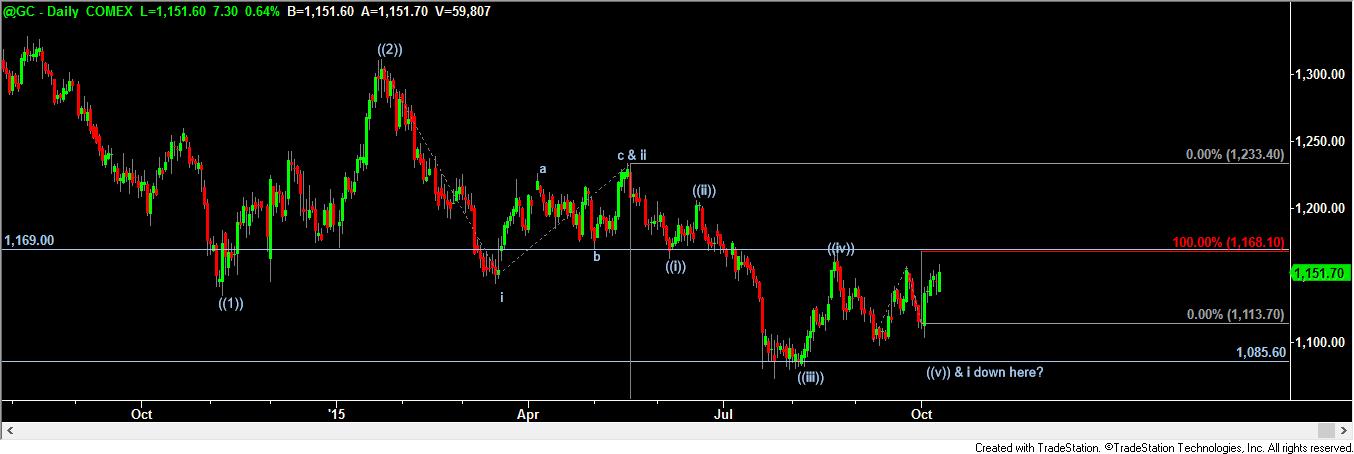
Gold futures have been on the rise this week on renewed speculation that the Federal Reserve and their global central banker cohorts are going to keep interest rates as low as possible for as long as possible.
The rally in gold has not yet reached the point of no return, however.
We are maintaining our skepticism on the gold market unless and until the 1169.80 resistance level is conquered on a closing basis.
We would be sellers of gold as close to 1169.80 as possible with stops in place on any close above 1170 and a downside target of 1086.
We would only be buying gold on a drop back down to 1086 or on a breakout above 1170 and subsequent re-test of that level.
Special Weekly Feature: Crude Oil Explodes Higher
Recap of last week’s thoughts on COPPER:
- Copper futures bounced up to the 61.8% retracement of the most recent decline last week and quickly retreated.
- We were sticking with our call for a move down to 2.1735 in copper before the current wave “((v)), (v), v & 5” has run its course.
- We noted we would be sellers of copper up at the 2.3766 resistance level and would honor a stop on a close above 2.38. We gave a downside target of 2.1735.
- UPDATE ON COPPER: Copper has actually continued its press to the upside – now threatening to close above the next resistance at 2.4007.
Here’s an updated chart of CRUDE OIL FUTURES:
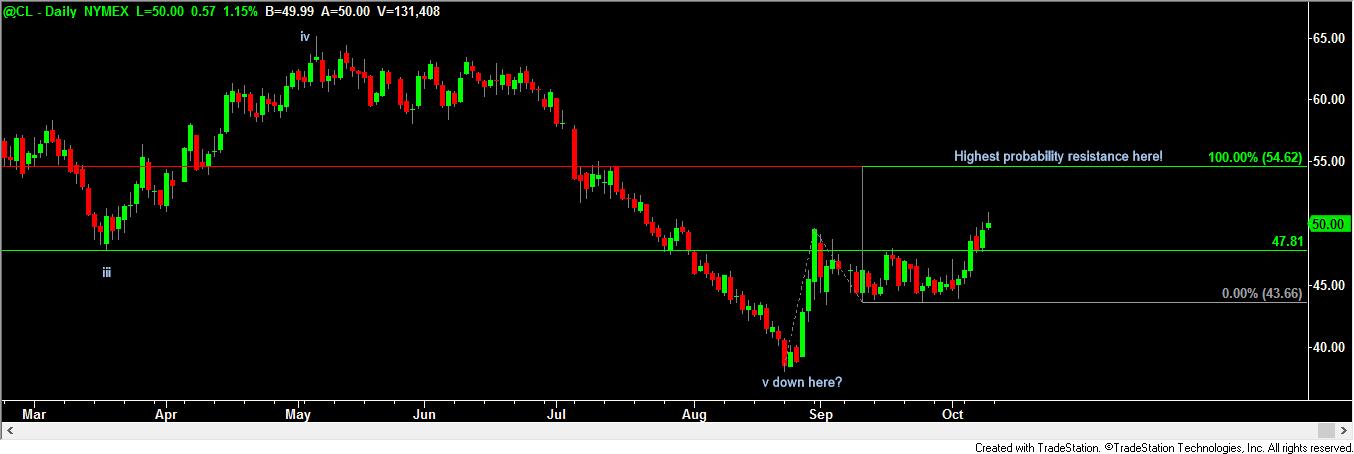
Crude oil futures have exploded to the upside this week on a weak US Dollar (induced by the perceived dovishness of the US Fed and the global central bankers) and renewed optimism (still delicate) about the fate of risk assets and the global economy.
We believe some technical evidence has lent itself to the energy of the rally as well. Based on our most recent look at the chart of crude oil, it appears that a continued move higher in crude should play out.
The resistance we project that might hold up comes in all the way up at $54.60. But, that is an eventual target – not necessarily one that will be hit Monday or even next week.
In the very short-term, we would anticipate a pullback to around $47.81 – the daily close on October 7th.
We would be buyers of crude oil on that pullback – should it occur – with the idea of holding on for a move up to $52.
Coffee continues to grind higher
Recap of last week’s thoughts on coffee:
- Coffee futures had continued their recent upside momentum. We noted we would cover and look to re-short at the 126.85 level. We pointed out that stops should be honored on any close above 126.90 and the downside target remains down at 103.11.
- We noted we would only be looking to buy coffee down at 103.11.
Here’s an updated chart of coffee futures:
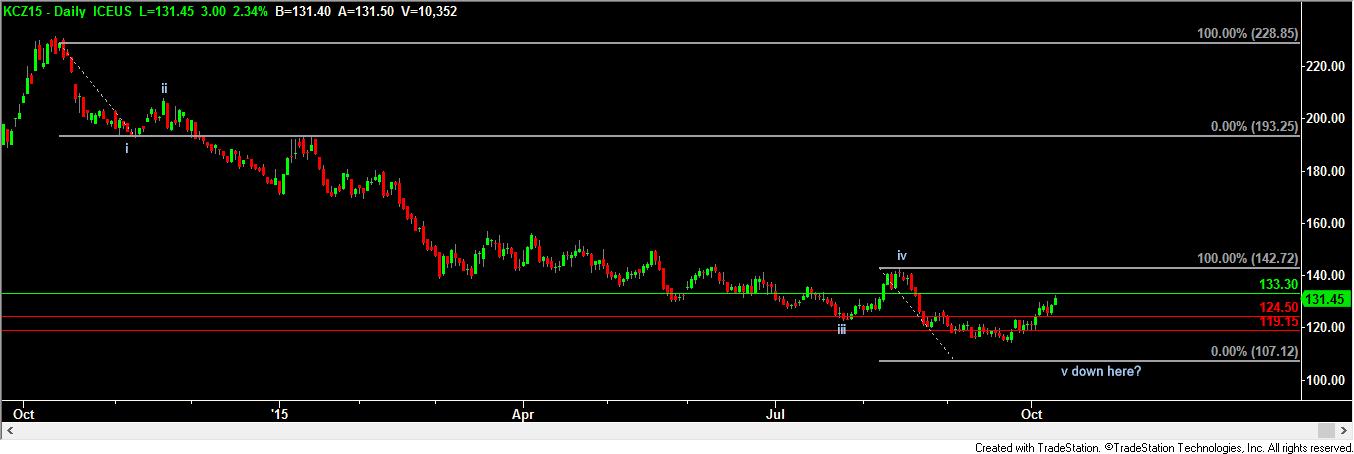
Coffee futures have continued their recent rally and are now nearing a projected short-term resistance level at 133.30.
From here, we are calling for a pullback to around 125 before even more upside may likely commence.
We would be sellers of coffee near 133.30 with stops in place on a close above 134 and a downside target of 125.
We would only be buying coffee at 125 or 119.15 support with stops in place on any close below 125 and 119 respectively. Our upside target will be 140.
Sugar rallies further than expected – bumping into next resistance
Recap of last week’s thoughts on sugar:
- Sugar continued to move higher last week – threatening a breakout above 13.49 key resistance.
- We noted we would be sellers of sugar at 13.49 with stops in place on a close above that level.
- We cautioned against buying until a breakout above resistance or a pullback to support occurred.
Here’s an updated chart of sugar futures:
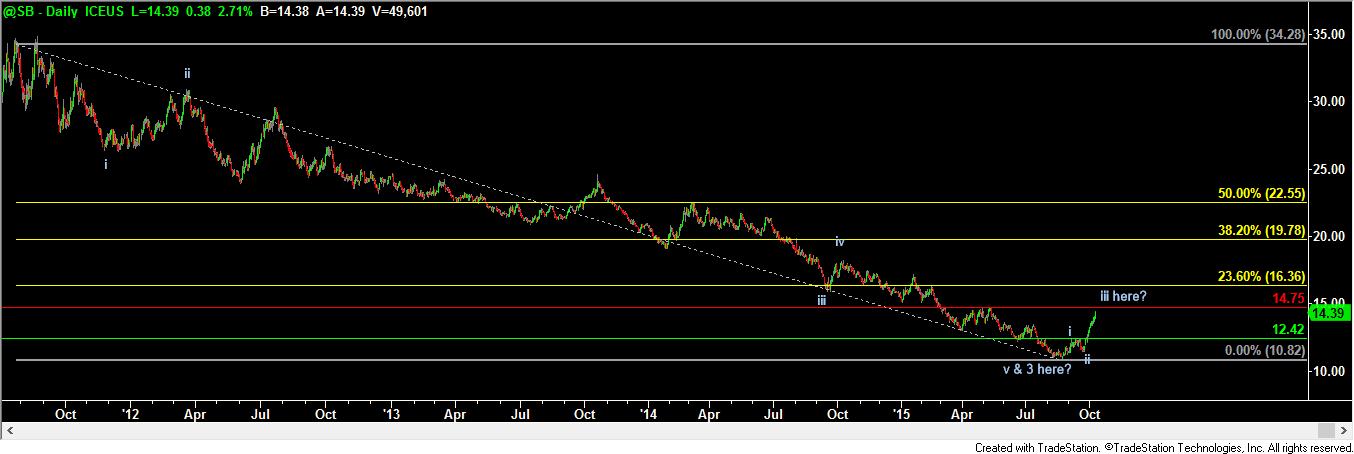
Sugar futures have broken through short-term and long-term key resistance – the resistance that would have kept us fully bearish on the commodity going forward.
That breakout has forced us back to the chart to evaluate where things may be headed – given the breakdown of our previous bearish thesis.
Right now, we are thinking sugar makes it up to 14.75 before a pullback should commence. When it does, we think 13.60 is the minimal pullback level to expect with the possibility of one all the way down to 12.42 looming.
We would be sellers of sugar near 14.75 and buyers at either 13.60 or 12.42. Use any close above 15 as a stop loss trigger on the short. Use any close below 13.50 or 12.40 as a stop loss on the long-side attempts.
Soybean Meal still trading bearishly
Recap of last week’s thoughts on Soybean Meal:
- Soybean meal futures appeared headed down to the eventual target range of 278.50 - 289.30.
- We noted we would be using any bounce up to 312.50 as an opportunity to sell SM futures.
- We further noted that we would hold off on buying SM futures until at least the 289.30 level is approached.
Here’s an updated chart of Soybean Meal:
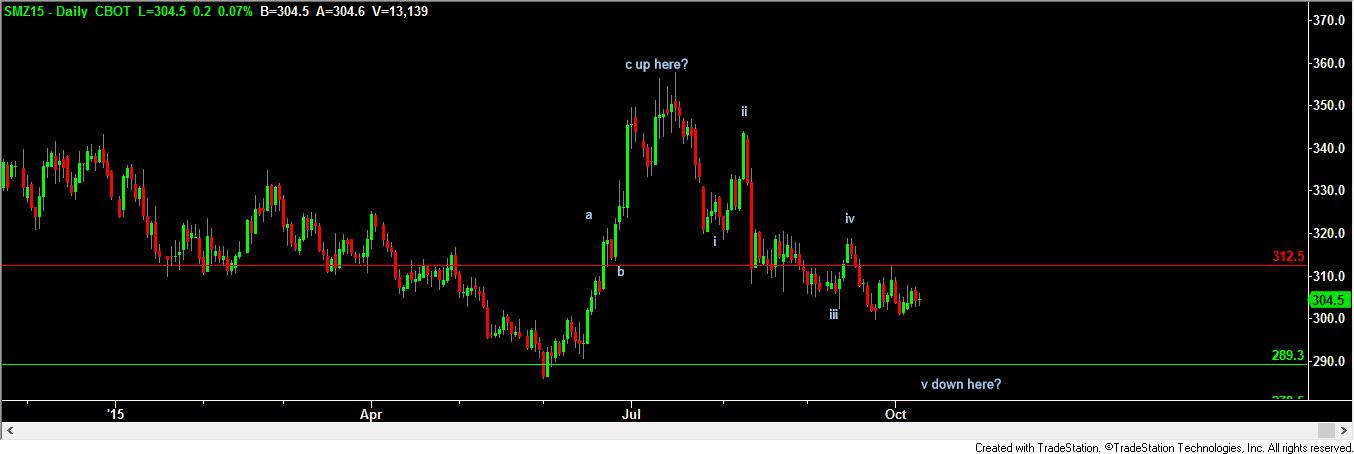
Soybean meal continues to sport one of the more bearish charts around. While other commodities are pressing to higher and higher resistance levels, SM futures seem to be unable to break out above even the closest “correction resistance” levels.
The nearest “correction resistance” level for soybean meal comes in at 309.70.
We would be sellers of SM futures at 309.70 and would have as our target the 278.50 – 289.30 range.
We would not be buying SM futures until the rest of the decline to 289.30 occurs.
Chicago Wheat has more room to run – perhaps after a brief pullback
Recap of last week’s thoughts on wheat:
- Wheat futures were bumping right into key “correction resistance” at 520 2/8 heading into last weekend.
- We gave a downside target of 465 2/8.
Here’s an updated chart of Chicago Wheat:
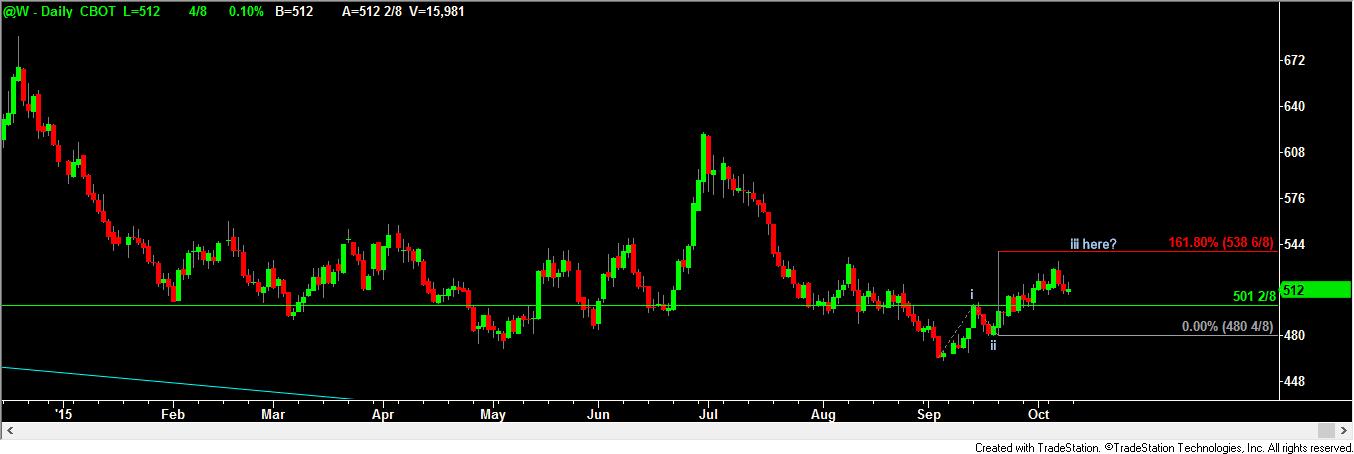
Chicago Wheat futures moved a bit higher than we anticipated in previous weeks’ reports. The up move has turned the chart for wheat more bullish in the short-term.
We feel that after a bit more of a pullback occurs – perhaps to 501 2/8 – that a continued run in wheat should take place. Our upside target for W futures comes in at 538 6/8.
We would be buyers of wheat near 501 2/8 and sellers near 538 6/8. Use a close below 501 or above 539 as a stop loss trigger on the respective trades.
Corn pulling back before what looks like more upside
Recap of last week’s thoughts on corn:
- Corn futures appeared to be grinding their way through an upside correction. We felt resistance came in at 400 – 405.
- We felt that prior to the final run up 400 – 405 that corn might dip down to either 375 or 369.
- We noted we would be sellers of corn at 391 with a downside target of 375 and a stop loss in place on any close above 391.
- We further noted that we would be buyers of corn at the 369 level with stops in place on any close below 368 and an upside target of 400.
Here’s an updated chart of corn futures:
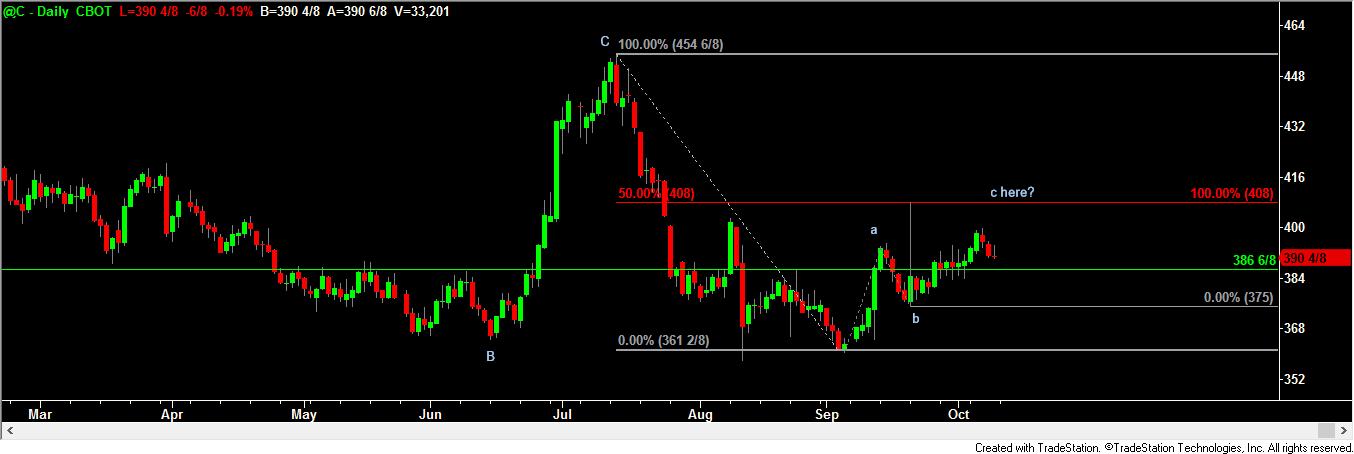
Corn futures are pulling back modestly after a nice run higher. The recent run exceeded short-term correction resistance and opened up the door to more upside in the near-term.
We now think corn has room to run up to 408 as long as short-term support at 386 6/8 holds up.
We would be buyers of corn near 386 6/8 with stops in place on a close below 385 and would have 408 as the upside trading target.
We would only be selling corn again near 408 with stops in place on any close above 409. The downside target range for corn still appears to be much lower – at least to the lows at 362.
Soybeans continue on their bearish track
Recap of last week’s thoughts on soybeans:
- Soybean futures bounced up to their “correction resistance” at 903 and reversed hard to the downside last week.
- We felt that soybeans should tumble all the way down to 820 or so before all the selling is done.
- We advised selling near 903 resistance and only considering buys to 820.
Here’s an updated chart of soybeans:
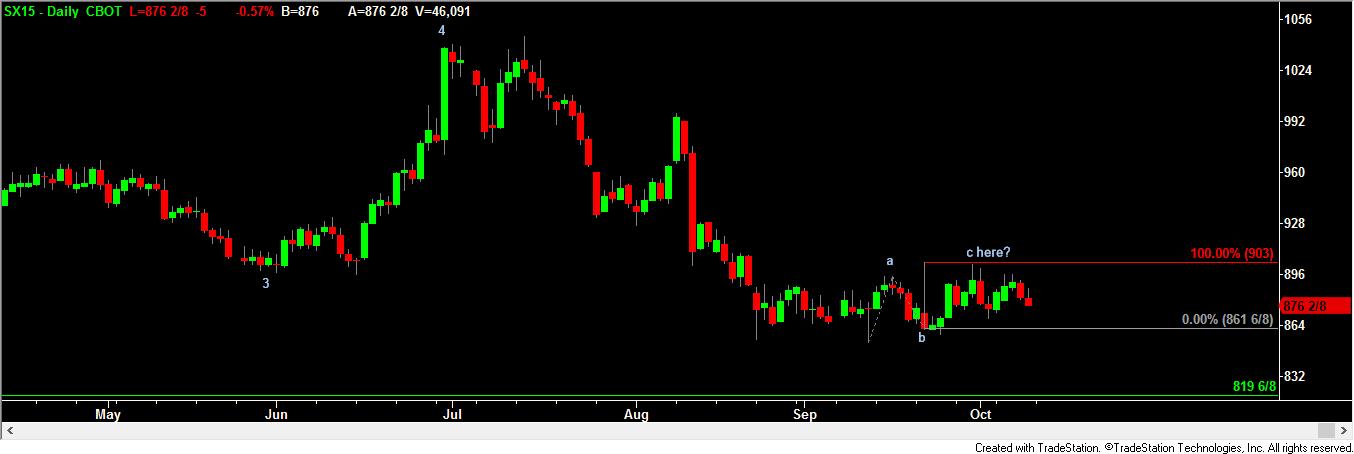
IMPORTANT NOTE: We are now using the chart of the November 2015 soybeans contract in this week’s report as it is the most critical / important of all the upcoming contracts AND its chart is vastly different from the continuous chart (rendering the analysis of that continuous chart less than useful in our opinion).
Soybean futures continue to trade very bearishly this week. Right now, soybeans appear to be in the midst of a downside wave (that appears to be the fifth of a five wave sequence).
This wave should – if our measuring techniques hold up – take soybean prices all the way down to 820.
We would be using any bounce to 903 as an opportunity to sell soybeans. We would use stops on any close above 903 and would still use 820 as a downside target.
Recent free content from Peak Analytics & Consulting
-
 S&P futures may see short-term bounce ahead of test of 4,005
— 8/26/22
S&P futures may see short-term bounce ahead of test of 4,005
— 8/26/22
-
NASDAQ futures update...
— 3/08/22
-
AAPL historical pattern could lead market lower
— 8/03/20
-
UPDATED S&P FUTURES LEVELS BASED ON TODAY'S ACTION...
— 12/20/18
-
Headed to 2412 - 2417
— 12/20/18
-
{[comment.author.username]} {[comment.author.username]} — Marketfy Staff — Maven — Member
Reviews


- 1 Campus Martius, Suite #200Detroit, MI 48226
- +1 877 440 9464