

AAPL historical pattern could lead market lower
Years ago, we wrote a piece for Minyanville.com covering a pattern we identified in AAPL shares and the major indices. Paraphrasing - AAPL runs up into and slightly past their earnings date and then pulls back a great majority of the time. Obviously, this action leads the market up and then down - which is never more likely than now given AAPL's increased market capitalization and influence on the indices.
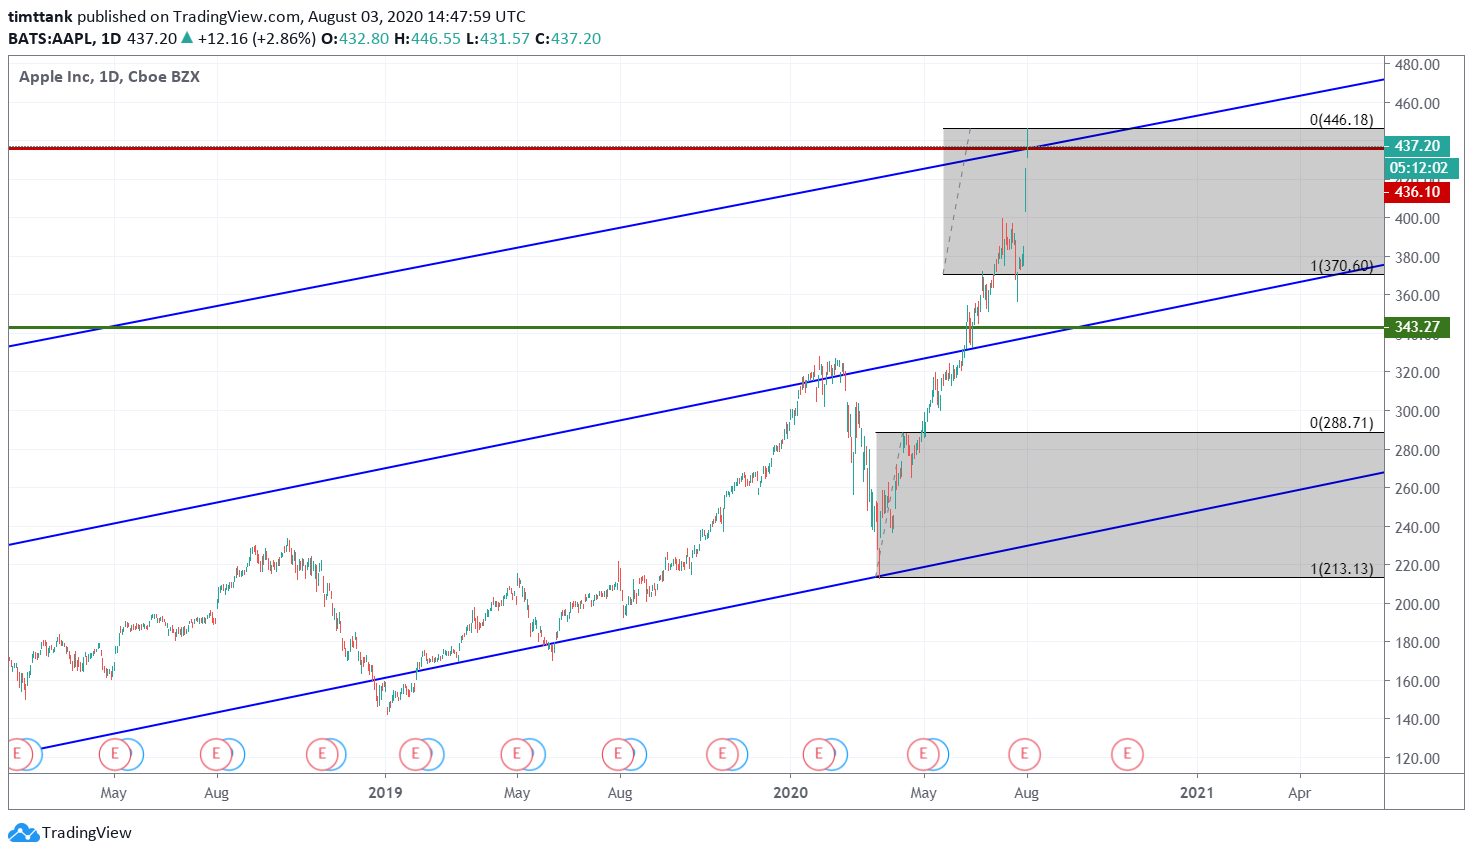
The chart above shoes AAPL touching the upper edge of the long-term uptrend channel today. The median uptrend line comes in at around $340 while the "wave 4" support would come in at $370.
So, let's make it official - we're calling for a top in AAPL and the market - for now - today and are expecting a pullback of 15% - 20-% in AAPL and a corresponding dip in the NASDAQ and S&P. Honestly, the action outside of FAANG + MSFT and perhaps the cloud stocks and TSLA hasn't been nearly as bullish as those leadership areas. A pullback in leadership should not be surprising to anyone at this point. But, the technical evidence on AAPL's chart above is pretty compelling from our viewpoint.
Be well!
Recent free content from Peak Analytics & Consulting
-
 S&P futures may see short-term bounce ahead of test of 4,005
— 8/26/22
S&P futures may see short-term bounce ahead of test of 4,005
— 8/26/22
-
NASDAQ futures update...
— 3/08/22
-
UPDATED S&P FUTURES LEVELS BASED ON TODAY'S ACTION...
— 12/20/18
-
Headed to 2412 - 2417
— 12/20/18
-
INTRA-WEEK UPDATE - OUCH!!
— 12/06/18
-
{[comment.author.username]} {[comment.author.username]} — Marketfy Staff — Maven — Member
Reviews


- 1 Campus Martius, Suite #200Detroit, MI 48226
- +1 877 440 9464