

Steady Trader Daily Hot Tech-Stock: Red Hat breaks out of bullish pattern
Red Hat Inc - RHT
On June 18 RHT reported better than expected results on both the top and bottom line and raised its outlook for the full year, which was also positively reflected in the stock price.
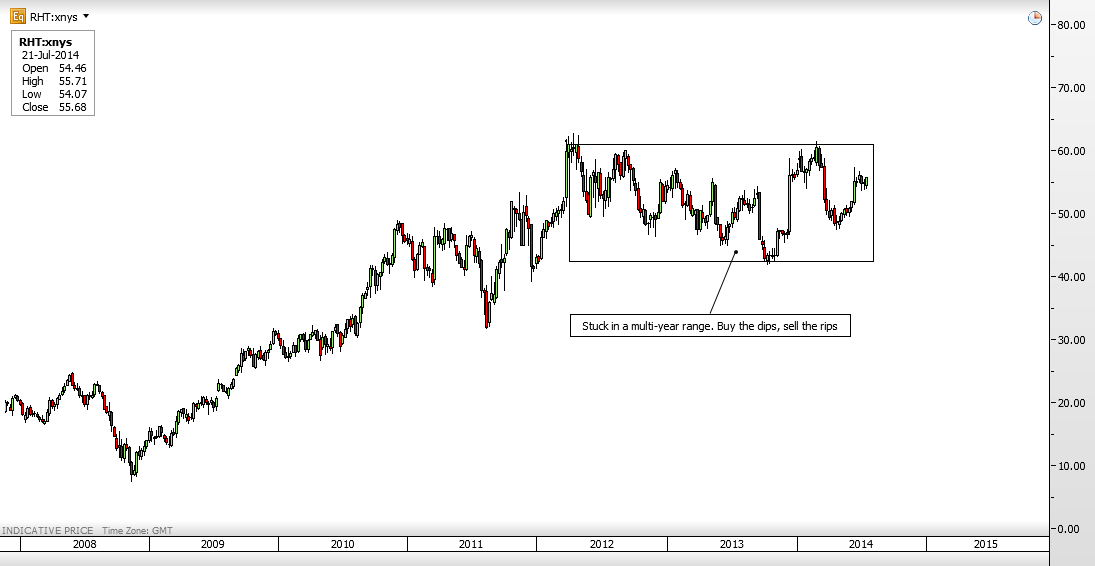
Looking at the multi-year weekly chart of RHT stock, note that after a sharp rise off the late 2008 bottom the stock ultimately topped out in early 2012 and has worked sideways since, albeit in a wide range. This is a good perspective to have as it tells us that, rather than trying to buy a breakout or short a breakdown, playing this wide range is the higher probability trade. In other words, we want to buy the dips and sell the rips, or at least somehow try to play the stock within the range.
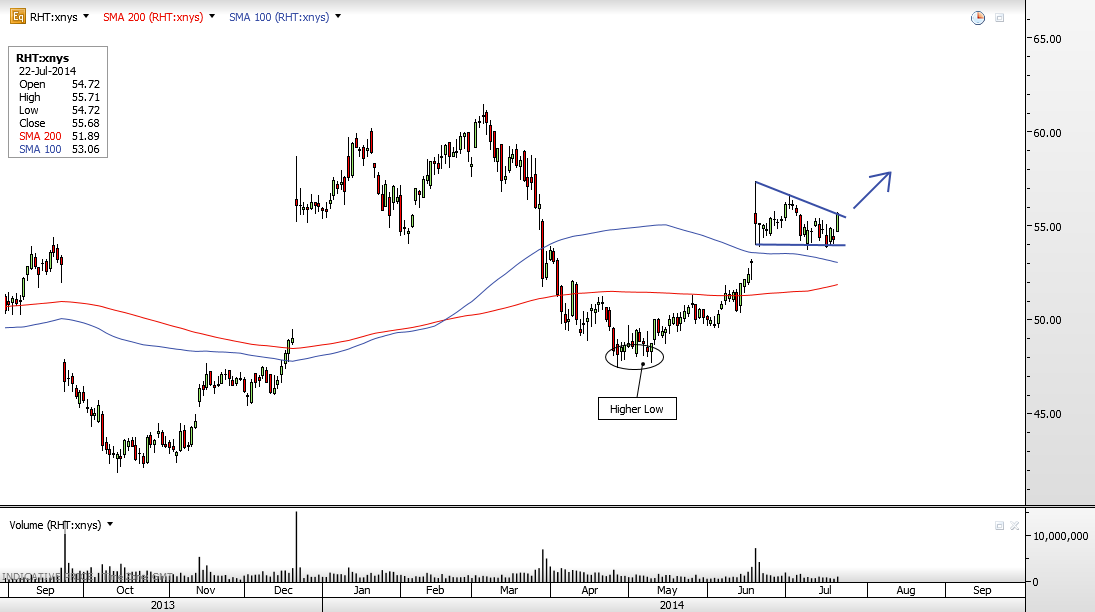
On the daily chart, note that the stock developed a good higher low in April and May versus its 2013 lows. The stock then jumped on favorable volume after the June earnings report and ever since has consolidated above its 100-day moving average in a constructive manner. Tuesday's rally now looks to have brought some upside momentum back into the stock that could take it toward $59 in coming weeks.
Recent free content from serge berger
-
 Steady Trader Daily Hot Stock: Biogen readies a move back to all time highs
— 7/24/14
Steady Trader Daily Hot Stock: Biogen readies a move back to all time highs
— 7/24/14
-
Steady Trader Daily Hot Tech-Stock: Jabil Circuit waves a bull flag
— 7/22/14
-
Steady Trader Daily Hot Tech-Stock: Google shares gain momentum after earnings
— 7/21/14
-
Steady Trader Daily Hot Tech-Stock: Salesforce.com looks heavy
— 7/18/14
-
Steady Trader Daily Hot Tech-Stock: Las Vegas Sands struggles
— 7/17/14
-
{[comment.author.username]} {[comment.author.username]} — Marketfy Staff — Maven — Member


- 1 Campus Martius, Suite #200Detroit, MI 48226
- +1 877 440 9464