

Tariff Man Set The Stage, Then The Machines Took Over
I opined after Monday's "relief rally" that the move had been a bit underwhelming and that uncertainty appeared to have crept back into the market. By Tuesday morning, traders began to realize that Trump may have over-tweeted the trade "deal" and the uncertainty creep was starting to look like a brisk walk. And by the time the lunch bell rang Tuesday, that brisk walk had morphed into an all-out sprint.
The question of the day is, why did stocks suddenly tank? The fear of the Fed overshooting had been put on the back burner. Trump appeared to be on the brink of a trade deal, which, as the bulls argued, should assuage the fear of a prolonged trade war wrecking the global economy. All of the above was supposed to result in less chance of the final big, bad fear becoming a reality - the fear that synchronized global growth would morph into a global recession. As such, stocks were "supposed" to rise. Especially given the tendency for stocks to move from the lower left to the upper right of the charts at this time of year.
But a not-so funny thing happened on the way to the Santa Claus rally. It appears that Santa's sleigh crashed on takeoff as the Dow tanked and finished with loss of 800 points.
I proceeded to spend most of Tuesday afternoon answering questions from my advisor clients and "esplainin" what the heck was going on. I was asked about the inversion of the yield curve, the status of the trade deal, the move in the bond market, the state of Brexit, Italian bonds, Deutsche Bank, bank stocks, the consumer and retail, risk parity's role in the move, and of course, the 200-day moving averages. So many worries, so little time!
My explanation went something like this. "Tariff Man" set the stage. A new worry took hold. The technicals broke big. And the machines took it from there.
Look, Up In The Sky, It's... "Tariff Man"
On the trade "deal" (a term that is being used more loosely with each passing day) front, recall that Trump's decision to appoint noted China trade hawk Robert Lighthizer to lead the negotiations with China raised some eyebrows. The thinking was that Lighthizer wasn't the guy to get a deal done in the next 90 days. Cue the concern.
Then on Tuesday morning we got the "Tariff Man" tweet. In his usual blunt fashion, the President said, "I want this deal to happen, and it probably will. But if not remember... I am Tariff Man."
Trump tweeted on, "When people or countries come in to raid the great wealth of our Nation, I want them to pay for the privilege of doing so. It will always be the best way to max out our economic power. We are right now taking in $billions in Tariffs. MAKE AMERICA RICH AGAIN."
Make no mistake about it; this wasn't exactly the "tone" the American people might have expected if we were on the brink of a deal with China. No, in short, this sounded a LOT like antagonistic negotiating. As a result, traders couldn't be blamed for thinking that a deal might not get done and that fears #2 and #3 may not have been removed after all.
I suggested to my clients that this "set the table" for stocks to pull back and allow traders to think about where we go from here.
The Next Worry: An Inverted Yield Curve (That Isn't Really Inverted!)
Next on the explanation list was the headline that the yield curve had inverted (meaning that short-term yields had moved above longer-term yields). As most every trader knows, an inverted yield curve is interpreted as a signal of future economic weakness.
In short, the blaring headlines and flashing announcements about the "inverted yield curve" caused folks to renew their fears about recession.
But... As I explained to my clients, there are a couple problems with this worry. First, the most common version of the yield curve is NOT inverted.
The version of the "yield curve" that most investors follow is the yield of the 2-year compared to the yield of the 10-year. And to be clear, the yield of the 2-year is still below the 10-year. This means it has NOT "inverted." (Insert shaking head emoji here.)
What got everybody's attention Tuesday was the fact that the yield of the 2-year had moved above the 5-year. Thus, the "2s-to-5s" had inverted and the alarm was sounded. Wrongly sounded in my opinion, but hey, headlines sell ads, right?
The key point is this "version" of the yield curve is NOT "THE VERSION" of the curve that most monitor. Oh, and for the record, the yield curve that the Federal Reserve monitors compares the Fed Funds Rate to the 10-year yield, which is not even close to inverting. But, again, let's not bother ourselves with needless details.
The second, and perhaps more important point is that while an inverted yield curve does have a good record of preceding recessions, there is usually a very large lag between the time the curve inverts and (a) the economy enters recession or (b) the stock market peaks.
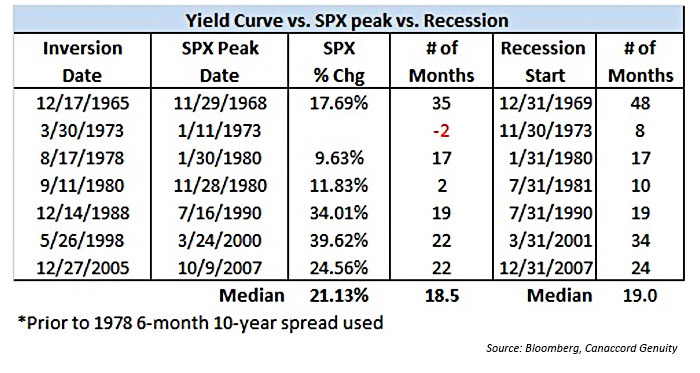
According to Canaccord Genuity's Chief Market Strategist Tony Dwyer, an inverted yield curve does tend to be a precursor to peaks in the stock market and to recessions in the U.S. But...
Of Inverted Yield Curves, Stock Market Peaks, and Recessions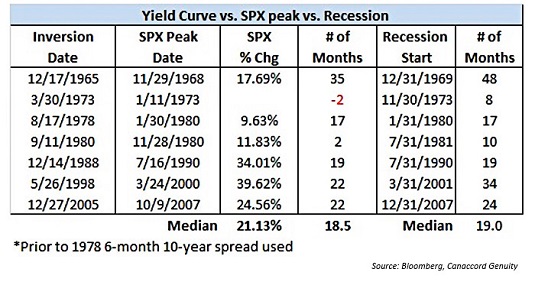
View Large Chart Online
Source: Tony Dwyer
Since 1965, the average time lag between the yield curve inverting and the ensuing peak in the stock market has been 16.4 months (the median was 18.5). During which time, the S&P 500 ADVANCED +22.9% on average (median: +21.1%). So, the real story is that the stock market has a marked tendency to rally after the yield curve inverts.
Dwyer also points out that the time between a yield curve inversion and the official start of a recession has been 22.8 months (median of 19).
So, in my big finish for point number 2, I opined that the idea of selling stocks now because some version of the yield curve had inverted was, well, more than a little silly. (Insert a round of applause here.)
That Snapping Sound You Heard Was...
Next, I opined that it was technical levels being broken on the charts of the S&P 500 and the yield of the 10-year T-Note that were the real keys to igniting the ferocious selling party on Tuesday.
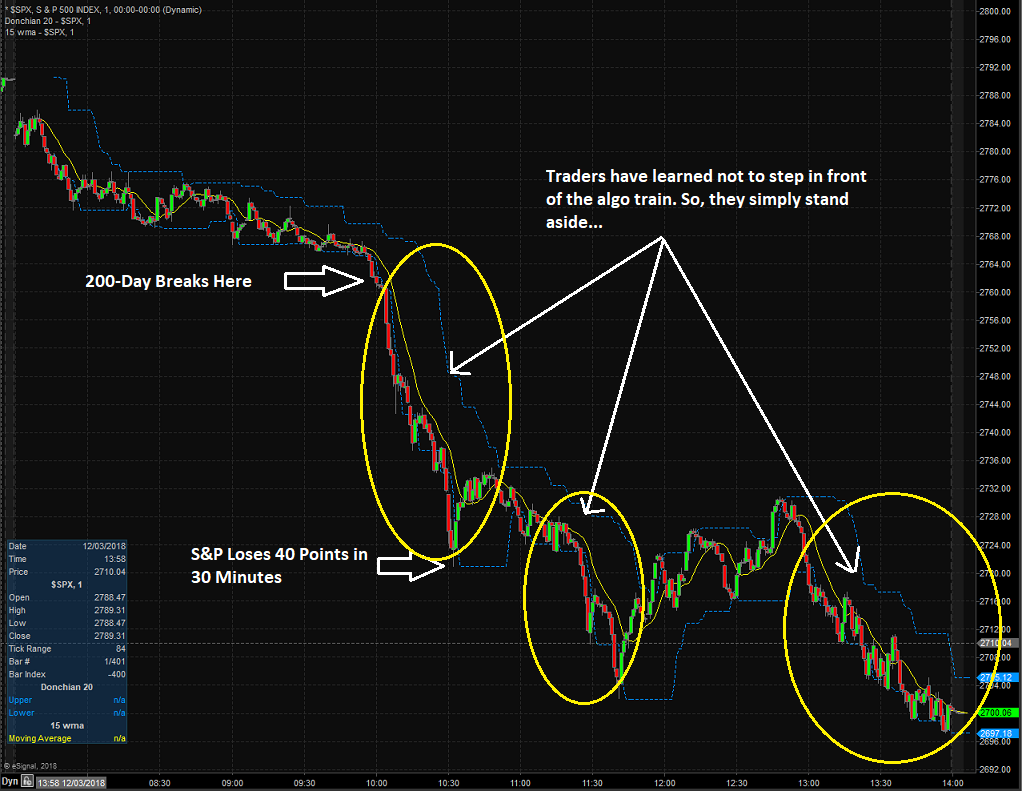
At precisely 11:58 am EST on Tuesday, the S&P 500 broke its 200-day moving average. This, when coupled with the fact that the yield on the 10-year had done the same earlier in the day, caused the algos to kick in - in a big way.
Don't take just my word for it. According to CNBC's Rick Santelli, $32 billion of sell orders for the S&P 500 futures hit when the 200-day was crossed. Wow.
Look at the 1-minute chart of the S&P 500 shown below and take note of the arrow on the left which shows the exact minute the 200-day broke. And then note what happened for the next 30 minutes. Can you say, whoosh?
S&P 500 - 1 Min
View Larger Chart
These types of moves without any accompanying story or headlines can only mean one thing - systematic selling. As in computers programmed to sell when a line gets crossed. Think stop levels. Or stuff like risk-parity triggers. Or traders front-running the obvious trigger points. But in any event, it's real. And it's indiscriminate (yes, in both directions). A line gets crossed and the computers spit out orders. Rinse and repeat.
The Machines Took It From There
In this case, the S&P 500 plunged 40 points in 30 minutes. All the while, the financial networks were telling us that people were concerned about the trade deal and the next recession. People. Ha. Right.
My guess is there were no "people" making trades between 12 noon and 12:32 pm EST on Tuesday. I seriously doubt that John Q Public and his wife Nancy had gotten on a call and decided to move their 401K's to cash Tuesday afternoon. No, this was computers executing orders - at the speed of light.
To be sure, this type of trading has been going on since the beginning of time. Heck, I've run many strategies over the years that bought and sold based on a specific level being hit. But nowadays it isn't just one order being executed by hand. No, it's hundreds, even thousands of orders being executed at the same time.
I opined that there are simply too many hedge funds, CTAs, trend-followers, strategies, etc. using the same algos at the same time. And the bottom line is traders have learned not to step front of the train once it gets rolling. I.E. While it may sound incredulous, there aren't investors willing to take other side of the trade. And this is the reason that we see moves get what I'll call ridiculous at times.
Let's also remember that this game gets played both ways. And it is indeed true that nobody complains about the "volatility" or "machines" when prices surge higher.
But I will also suggest that the "environment" has a lot to do with how far the machines are able to push prices. For example, the big question currently is if we're seeing a "healthy corrective phase" or the start of a bear market. Thus, each headline touting a 500-, 600-, or 800-point puke can cause buyers to sit on their hands for a while - especially given the date on the calendar.
So, to sum up Tuesday's eye-popping dance to the downside, Trump and the new big fear set the table for the bears and the technicals caused the computers to go into hyperdrive. The machines took over and since nobody wanted to be a step in front of the train, the move got out of hand. That's my story and I'm sticking to it.
Big Picture Perspective
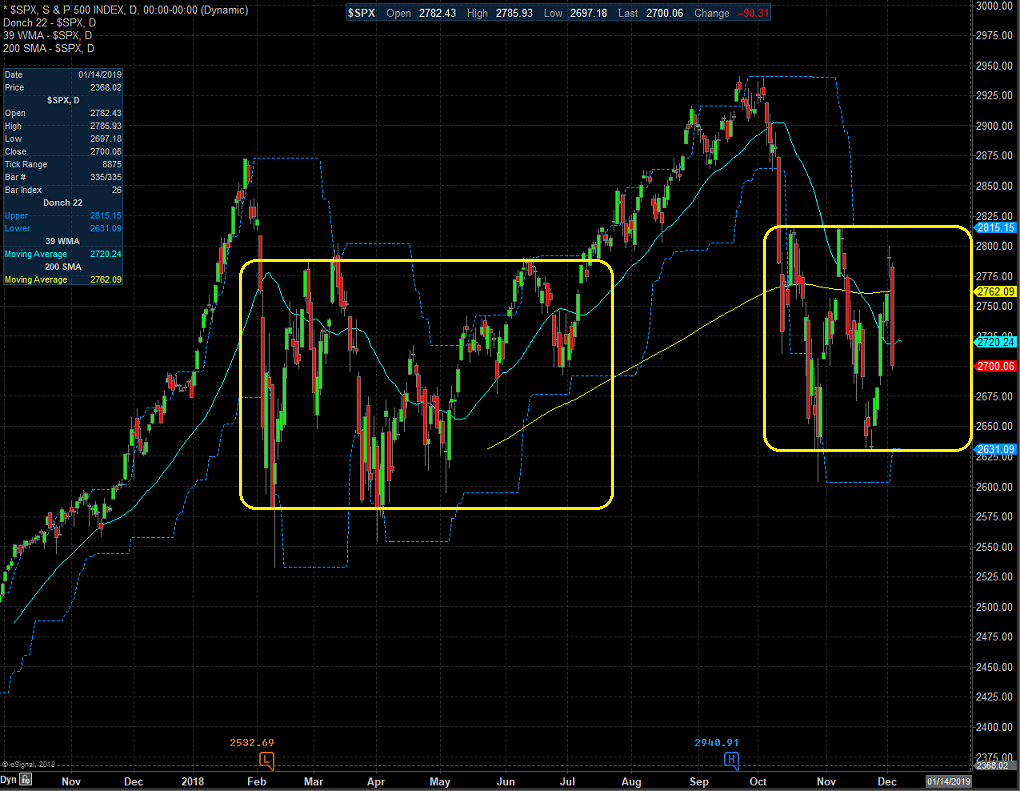
The bad news is stocks got smoked on Tuesday. The good news is that from a bigger-picture perspective, stocks appear to be stuck in a very large range. See below.
S&P 500 - Daily
View Larger Chart
This is yet another part of the reason why Tuesday's move became outsized. There was no important support. No obvious turning point for the machines to "go the other way." There was no line in the sand for the bulls to defend. No, that comes a bit lower between 2630 and 2600. This is where I'd expect to see a real battle take place.
The calm, cool, and collected types even suggest that this is merely part of the "basing" process. We shall see.
Finally, I will note that a similar range took place earlier in the year. This one was eventually resolved to the upside. Time will tell which team wins the current contest.
This just in... The hysterics in the stock market will continue this morning as the arrest of a top Chinese tech executive has added to the worry over US-China relations/negotiations. Thus, it appears that a full-on test of the October/November lows is "on" with many analysts suggesting that a test of the February is next.
Thought For The Day:
Excellence is not a singular act, but a habit. You are what you repeatedly do. -Shaquille Oneal
Wishing you green screens and all the best for a great day,

David D. Moenning
Founder, Chief Investment Officer
Heritage Capital Research
HCR Focuses on a Risk-Managed Approach to Investing
What Risk Management Can and Cannot Do

ANNOUNCEMENT:
HCR Awarded Top Honors in 2018 NAAIM Shark Tank Portfolio Strategy Competition
Each year, NAAIM (National Association of Active Investment Managers) hosts a competition to identify the best actively managed investment strategies. In April, HCR's Dave Moenning took home first place for his flagship risk management strategy.
<hr>Disclosures
At the time of publication, Mr. Moenning held long positions in the following securities mentioned: none - Note that positions may change at any time.
The opinions and forecasts expressed herein are those of Mr. David Moenning and may not actually come to pass. Mr. Moenning's opinions and viewpoints regarding the future of the markets should not be construed as recommendations. The analysis and information in this report is for informational purposes only. No part of the material presented in this report is intended as an investment recommendation or investment advice. Neither the information nor any opinion expressed constitutes a solicitation to purchase or sell securities or any investment program.
Any investment decisions must in all cases be made by the reader or by his or her investment adviser. Do NOT ever purchase any security without doing sufficient research. There is no guarantee that the investment objectives outlined will actually come to pass. All opinions expressed herein are subject to change without notice. Neither the editor, employees, nor any of their affiliates shall have any liability for any loss sustained by anyone who has relied on the information provided.
Mr. Moenning may at times have positions in the securities referred to and may make purchases or sales of these securities while publications are in circulation. Positions may change at any time.
The analysis provided is based on both technical and fundamental research and is provided "as is" without warranty of any kind, either expressed or implied. Although the information contained is derived from sources which are believed to be reliable, they cannot be guaranteed.
Investments in equities carry an inherent element of risk including the potential for significant loss of principal. Past performance is not an indication of future results.
Recent free content from FrontRange Trading Co.
-
 Is The Bull Argument Too Easy These Days?
— 8/31/20
Is The Bull Argument Too Easy These Days?
— 8/31/20
-
What Do The Cycles Say About 2020?
— 1/21/20
-
Modeling 2020 Expectations (Just For Fun)
— 1/13/20
-
Tips From Real-World Wendy Rhoades
— 5/06/19
-
The Best Recession Ever!
— 4/29/19
