

SPY UPDATE 5/28/15 GOT GAPS?
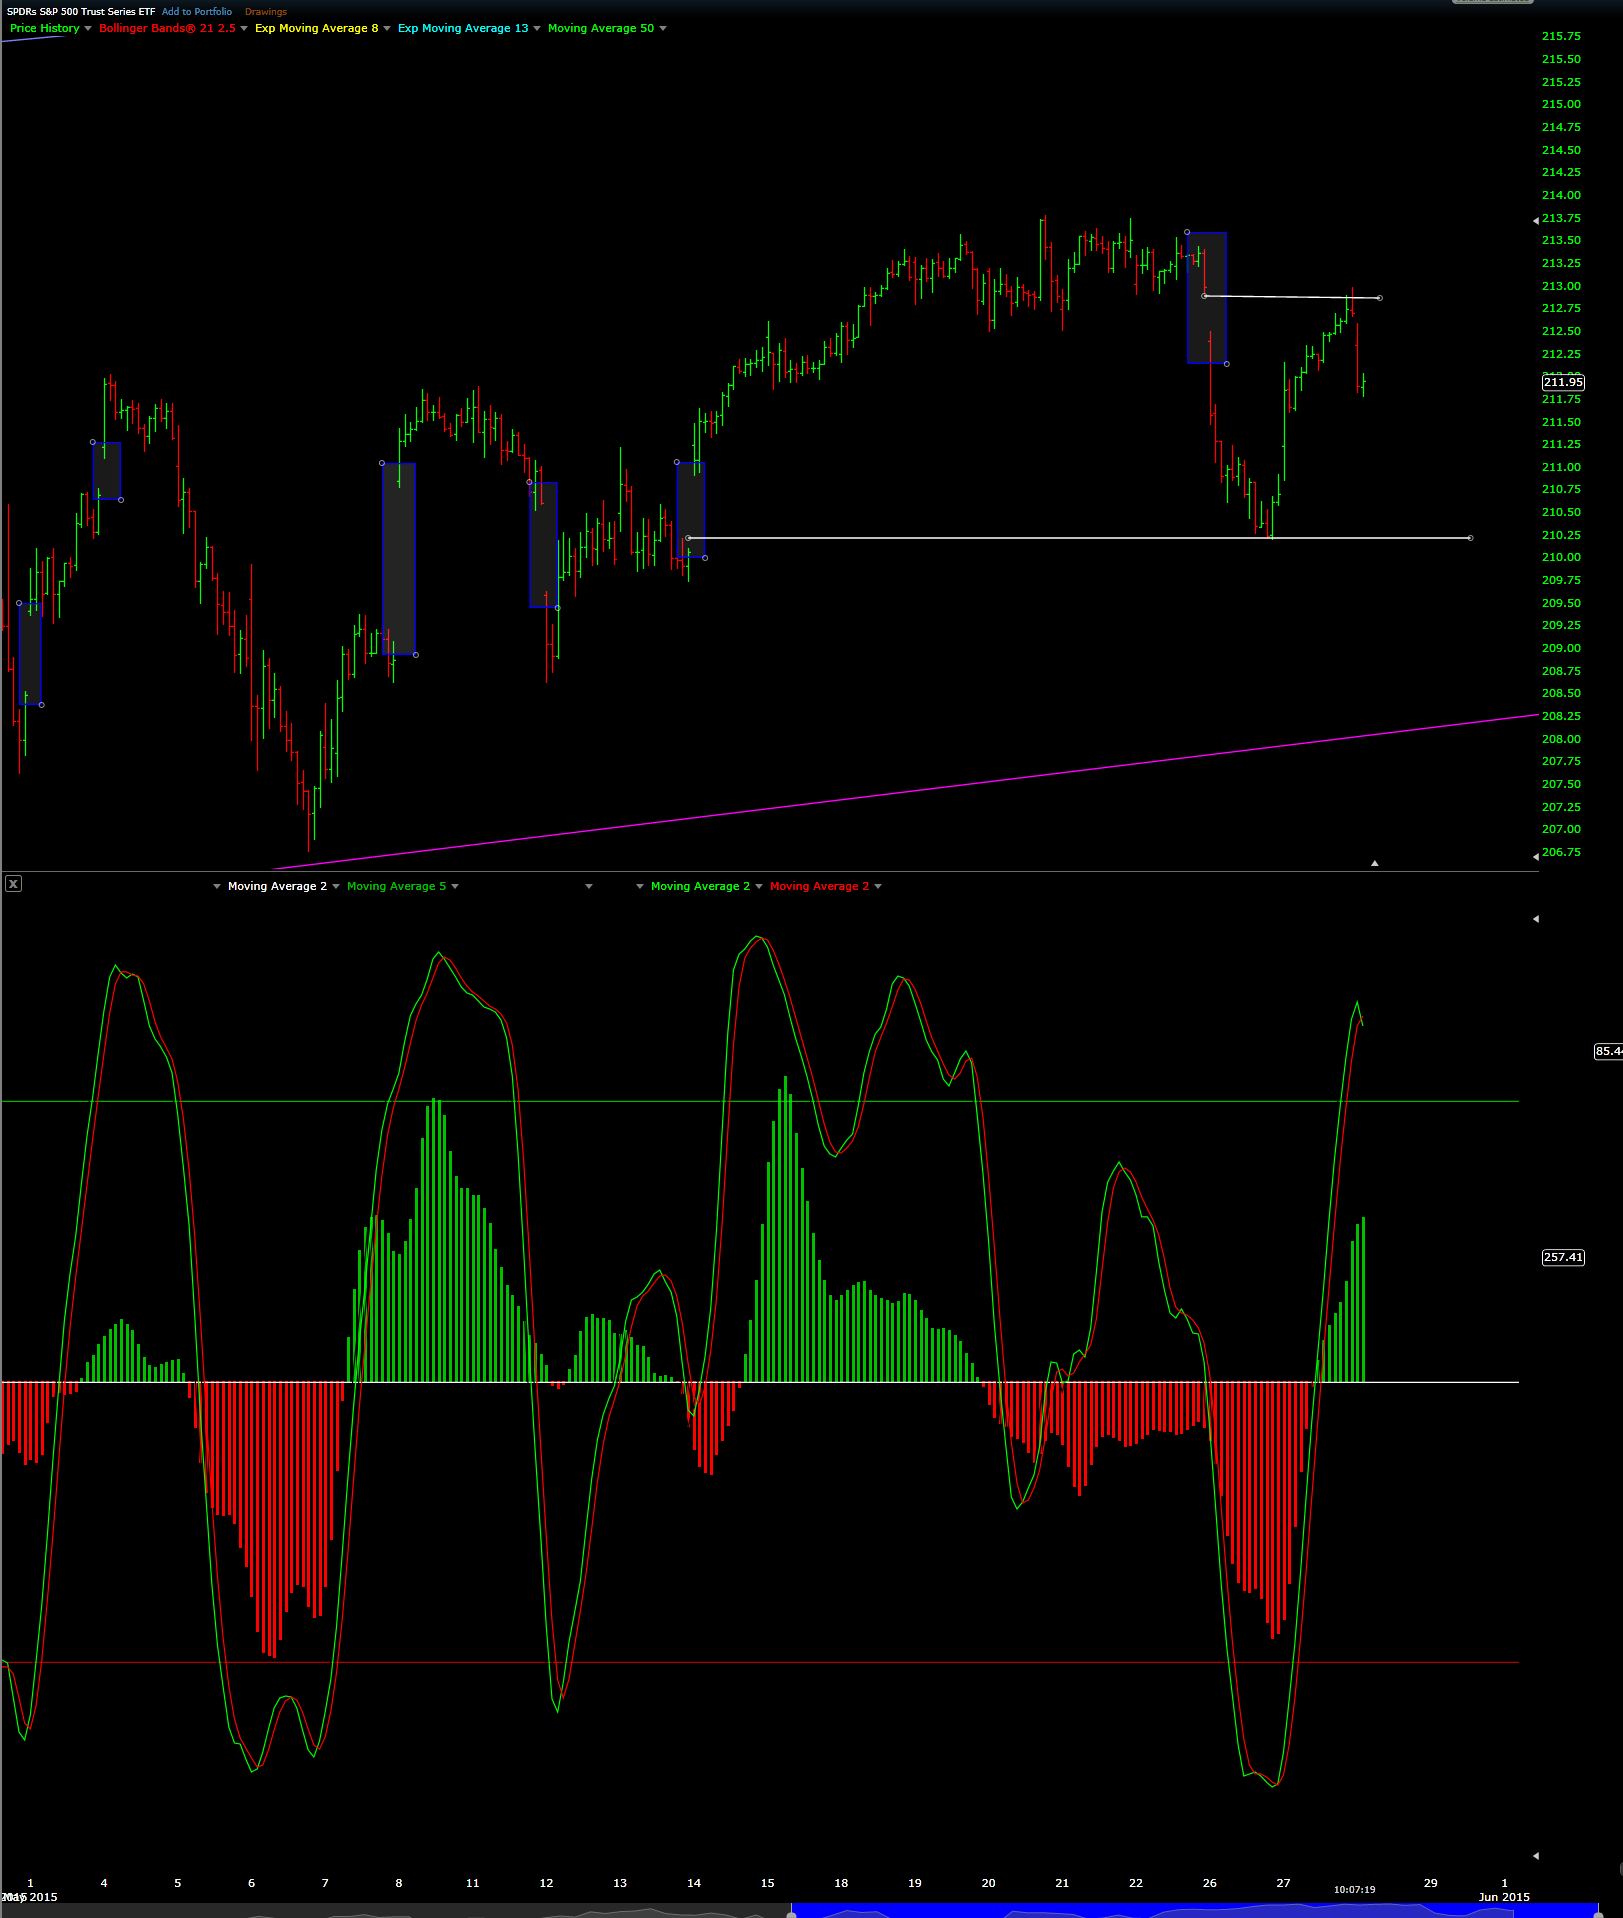
The SPY has closed all opening gaps since the beginning of May 2015. As is often the case, opening gaps are usually closed within a relative short time. The 30 min bar chart below highlights this very short term trading strategy. For those not familiar with what the gaps represent, note the trading areas highlighted with the blue boxes. These represent "gaps" in trading price when the instruments opens outside of the trading range of the previous day. For example on May 22nd the SPY's lowest trading price was 212.92 on the opening of the next trading day, the SPY opened at 212.32 and for the first 30 minutes of trading never traded above 212.50 creating that break or gap in the pricing action. The SPY continued to trade lower on the session to a low of 210.20. As I mentioned earlier, these gap in price are usually filled before resumption of the trend direction that created the gap in the first place or as is the case at times, in the complete opposite direction.
On the 27th of May, the SPY traded higher and "closed the gap" (note the straight line between the closing low of the last bar prior to the gap and the high point where the gap closed. Again these gaps are usually closed but not necessarily in one trading session as you can see in the prior example where the gaps did not close for several days.
I also wanted to note that the recent trading low also closed a previously open trading gap to the upside on the 14th of May.
Recent free content from CJ Mendes
-
 IEF 7/10 Year Ishares ETF - 6/9/15
— 6/09/15
IEF 7/10 Year Ishares ETF - 6/9/15
— 6/09/15
-
QQQ Trading Gap Filled 6/9/2015
— 6/09/15
-
NFLX - TIME TO TAKE SOME CHIPS OFF THE TABLE 6/4/15
— 6/04/15
-
SPY- BROAD MARKET UPDATE 5/18/15
— 5/18/15
-
WMT - WAL-MART 5/12/15
— 5/12/15
-
{[comment.author.username]} {[comment.author.username]} — Marketfy Staff — Maven — Member

- 1 Campus Martius, Suite #200Detroit, MI 48226
- +1 877 440 9464