

The NEW Daily Decision for 11.5.18 - Garden-Variety So Far, But...
The State of the Markets:
I've got an early meeting (who's idea was it to schedule a board meeting for 7:00am on a Monday??) and I am traveling the rest of the week, so I'm up early and would like to apologize in advance if this morning's market missive meanders more than normal!
From my seat, the key question of the day/month/quarter is if the current correction will morph into a cyclical bear. So far at least, the downside action we've seen since the beginning of October would qualify as a garden-variety correction. Yes, the action has been wild and woolly at times as the machines push the market to and fro at an eye-popping rate. Yet, it is important to recognize that on a closing basis, the S&P's decline has totaled -9.88%, which by historical standards is pretty standard fare as corrections go.
The damage done to the Smallcaps and Midcaps has not been quite as orderly as the iShares Russell 2000 ETF (NYSE: IWM) has pulled back -15.6% at its low and the SPDR Midcap 400 has dropped -12.9%.
This is to say nothing of the outright bear market that is occurring in so many markets outside our shores. For example, the iShares China EFT (NYSE: FXI) had fallen -29.15% as of Monday's close, Europe (as measured by the iShares Eurozone ETF - symbol EZU) was down -22.6%, and the emerging markets (NYSE: EEM) were off -27.8%.
The problem is that since 1970, there have been 31 corrections of 10% or more in the global markets. The median decline has been -19% on the ACWI (the current decline is -13.6%) and the odds of the decline growing to -15% or more is 55%. The important thing to remember is that we now live in a global marketplace. As such, it is tough for any single country to avoid the pain if the rest of the global markets are in a world of hurt. Thus, it isn't much of a stretch to think that there may be some additional downside ahead in the global markets and that the U.S. might have some catching up to do.
Putting The Correction in Perspective
To clarify, my view is the secular bull market that began on March 9, 2009 is ongoing and is not at risk here. And even if the bears do get their game on and push the S&P below the February lows (a move that would undoubtedly invigorate the bears to push prices lower - likely in a "whoosh" fashion), this is unlikely to change. So, we're not talking about another market Armageddon such as occurred in 2000-02 and 2007-09. No, instead, I think we're talking about a cyclical move (aka a "mini" bear) within the context of a secular bull trend.
Valuations Might Provide a Clue
In pondering the question at hand (as in, will we see a cyclical or "mini" bear unfold in the coming months?) I found myself tinkering around with valuation metrics. The chart below caught my eye.
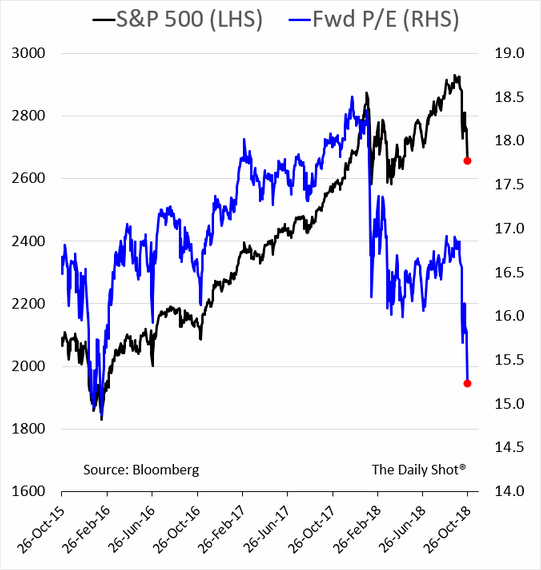
At first blush, this chart appears to be encouraging because the blue line, which is the the S&P's "Forward P/E" (the Price-to-Earnings ratio using the estimated earnings for the next 12 months) is suddenly much lower/improved. In fact, it's back to where it was in February of 2016. You know, the last time a cyclical bear market ended. This is good, right?
Being curious, I then wondered about the upside potential from this new, much improved valuation level. So, I dug into the NDR database and found that the 12-month projection for EPS (earnings per share) of the S&P 500 is $176.52.
The Upside Projection
I then grabbed my trusty solar-powered calculator and did some math. I figured that once this correction blew over, the market multiple would return to "normal." And based on the latest cycle, it looked to me that the Forward P/E could easily advance back to the 17 to 17.5 range without the bears screaming about things becoming overheated again. After all, 17 - 17.5 is about the middle of what we've seen over the last three years.
Doing some additional work on the calculator, I found that the S&P could advance to the 3000 - 3090 zone based on this range for the Forward P/E multiple. From Friday's close, this means the market would have upside potential of between 10% and 13.4% over the next year. Not too shabby, right?
I then decided to dig deeper. I was curious as to what the long-term average was for the Forward P/E multiple. In short, this is when the air went out of my upside argument balloon.
You see, the average Forward P/E multiple over the last 35 years has been... wait for it... 14.8. Ugh.
So... 14.8 times $176.52 is 2612, or 4.2% BELOW where the S&P closed on Friday. Thus, if we see average multiples applied to the earnings estimates (estimates that are usually revised lower as time goes on), the upside in the market for the next 12 months is -4.2%. Not exactly a desired result.
Normal or "Abby Normal?"
But... We are not living in "normal" times, are we? No, we currently live in a world where stocks are the best game in town. And because of this, investors have been willing to pay more for a dollar of earnings than they did in the past. And as long as this remains the case, the bulls can't be blamed for holding out some hope.
Finally, I'm reminded of the fact that the best returns typically come from the depths of bear-market despair. So, if the bears are able to find their mojo and can push prices lower in the coming days/weeks/months, it means that opportunities will present themselves once the bear cycle ends. And yes, the bear cycle will end. It always does!
Moving On... Now let's turn to the weekly review of my favorite indicators and market models...
The State of the Big-Picture Market Models
I like to start each week with a review of the state of my favorite big-picture market models, which are designed to help me determine which team is in control of the primary trend.
View My Favorite Market Models Online
The Bottom Line:
-
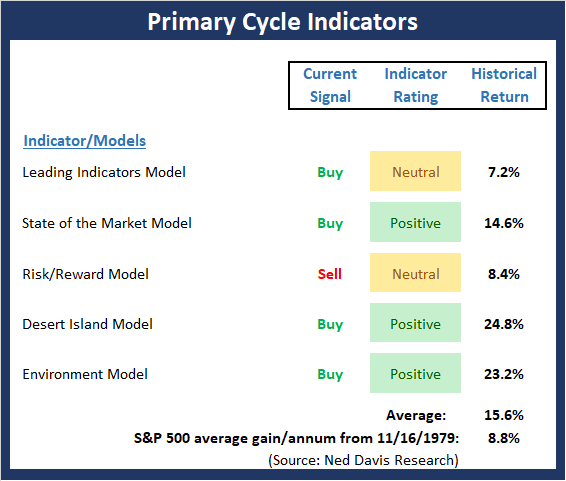
The Primary Cycle board continues to send an interesting message. While the board did a spledid job of providing an early warning that all was not right with the world well before the current corrective phase began, the message now appears to be more upbeat. Thus, my takeaway is that the secular bull remains intact and that we are currently seeing either a garden-variety correction, which was triggered by fear/undertainty over the course of Fed policy, the state of the Trade War, and the impact of the mid-term Elections, or the early phases of a cyclical or "mini" bear. Stay tuned.
This week's mean percentage score of my 5 favorite models improved to 63.5 (from 62.0%) while the median also advanced to 75% (also from 70%). Finally, it is worth noting that the historical return of the S&P 500 given the current model readings is well above the average.
The State of the Trend
Once I've reviewed the big picture, I then turn to the "state of the trend." These indicators are designed to give us a feel for the overall health of the current short- and intermediate-term trend models.
View Trend Indicator Board Online
The Bottom Line:
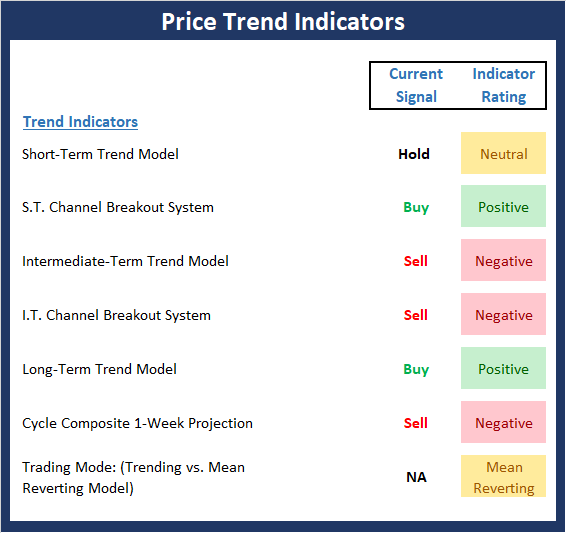
- Like the major averages, the Trend board has improved a bit to start the week. However, make no mistake about it; a fair amount of technical/trend damage has been done during the decline. Thus, unless there is an actual deal with China and Powell announces the Fed is going to pump the brakes or become "data dependent" in 2019, we can probably expect a bottoming process to play out. The good news is that we are now in the most favorable seasonal period and any good news on any of the news fronts could be rewarded with higher prices.
The State of Internal Momentum
Next up are the momentum indicators, which are designed to tell us whether there is any "oomph" behind the current trend.
View Momentum Indicator Board Online
The Bottom Line:
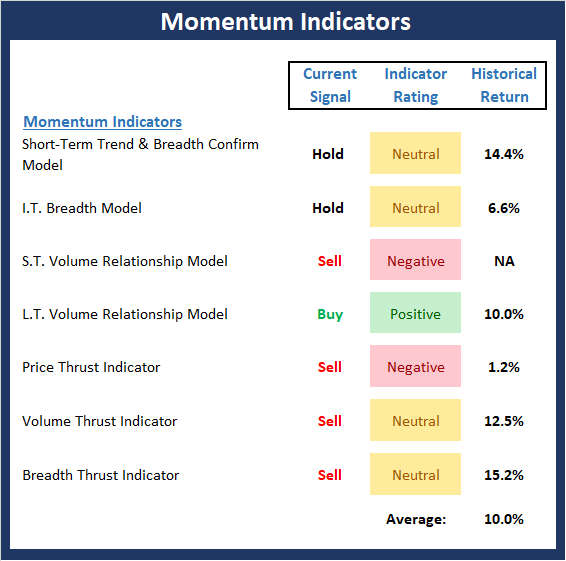
- There is some good news to report on the momentum front this week. First, our I.T. Breadth Model, which had been very close to issuing an important sell signal, improved last week. This is one of the first positive signs from the momentum category we've seen in a while. Next, the Price Thrust indicator reached the "it's so bad, it's good" zone and has now reversed. And finally, while both the Volume and Breadth Thrust indicators remain on sell signals, the readings upticked to neutral. The end result is a historical return that is above the mean.
The State of the "Trade"
We also focus each week on the "early warning" board, which is designed to indicate when traders might start to "go the other way" -- for a trade.
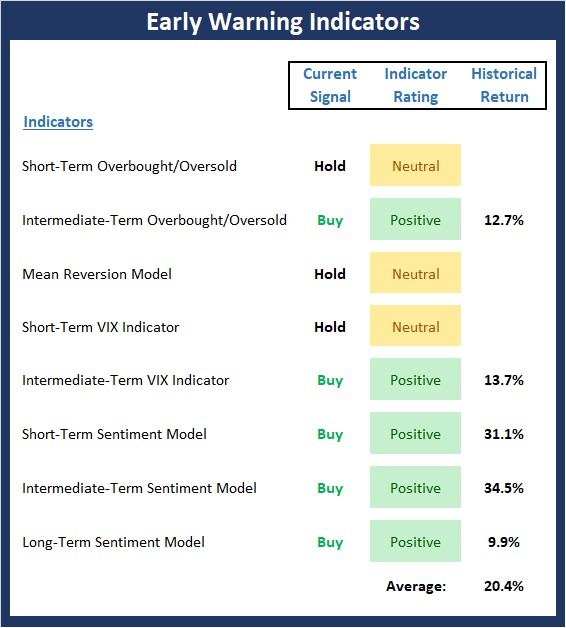
View Early Warning Indicator Board Online
The Bottom Line:
- The "Early Warning" board, which, as I've been saying, did a great job of alerting us to the fact that the table had been set for the bears, continues to give the near-term edge to the bulls. It is worth noting that (a) some of the short-term oversold condition has now been worked off, (b) the Mean Reversion model (which gave a timely buy signal last week) is now back to neutral, and (c) sentiment remains negative enough to continue to favor the bulls.
The State of the Macro Picture
Now let's move on to the market's "environmental factors" - the indicators designed to tell us the state of the big-picture market drivers including monetary conditions, the economy, inflation, and valuations.
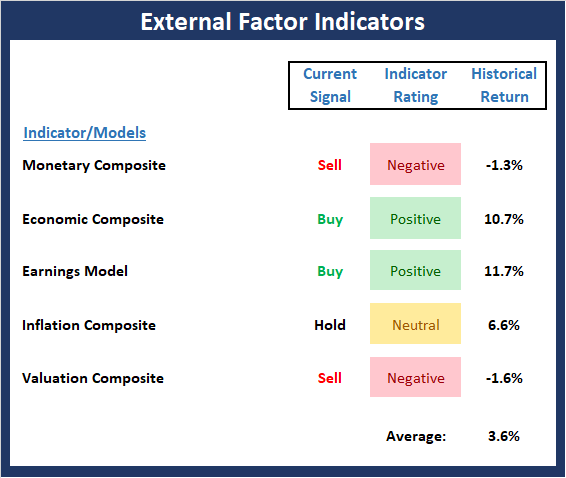
View Environment Indicator Board Online
The Bottom Line:
- There are only slight changes to the External Factors board this week. First, and perhaps most importantly, the Inflation model, which has done a great job alerting us to the trend of inflation over the past three years, appears to have reversed. And while the reading is still in the neutral zone, the trend is important here. Thus, this remains something to keep an eye on in the coming months. In addition, all of our favorite Valuation models are showing improvement. But, the bad news is all remain in the "very overvalued" zone. So, while I hate to sound like a broken record, this board tells us the risk factors remain elevated.
Thought For The Day:
If you don't like something, change it. If you can't change it, change your attitude. -Dr. Maya Angelou
Today's Portfolio Review
Here is the current positioning of the portfolio and our member ratings:
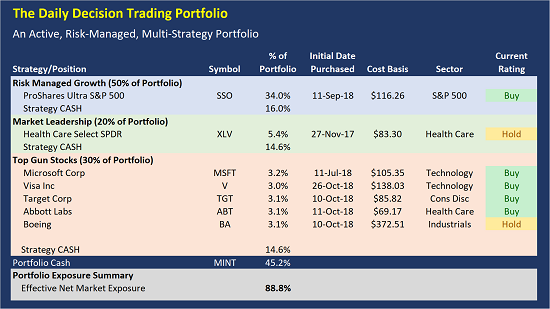
Effective Net Market Exposure Explained
The Effective Net Market Exposure is the "net long" position of the overall model portfolio after factoring in the impact of leveraged long positions such as SSO and QLD and/or short positions. Leveraged ETFs such as SSO are designed to deliver approximately twice the daily return of the underlying index. Thus, a 10% holding in the SSO equates to a 20% "net long" position to the portfolio.
Current Rating Explained
This is our rating for the day. The Current Rating tells you what action we would take if we did not currently hold the position. A "Buy" rating means we would be willing to purchase the position at current prices. A "Strong Buy" suggests this would be our first choice to buy. A "Hold" rating indicates we would not make new purchases at current levels. And a "Sell" rating indicates we will likely exit the position in the near-term.
Positions Can Change
Positions often change during the trading session. Remember that we will send a Trade Alert via SMS Text Message and/or Email BEFORE we ever make a move in the models.
Disclosure
At the time of publication, the editors hold long positions in the following securities mentioned:
SSO, XLV, AAPL, MSFT, TGT, ABT, BA, WM, V
- Note that positions may change at any time.
About the Portfolio:
The latest upgrade to the Daily Decision service went live on Monday, July 9. The new, state-of-the-art portfolio employs a modern, hedge fund style approach incorporating multiple methodologies, multiple strategies, and multiple time-frames. The portfolio is comprised of three parts:
- 50% Aggressive Risk-Managed Growth (up to 300% long)
- 20% Market Leaders
- 30% Top Gun Stocks
The Aggressive Risk-Managed Growth portion is made up of five trading strategies and accounts for 50% of the portfolio. The Market Leadership portion makes up 20% of the portfolio. And the Top Guns Stocks portion (10 of our favorite stocks) will make up the final 30% of the portfolio.
All three of our strategies are run in a single Marketfy model - the model is currently labeled as the LEADERS model. The goal is to make the service simpler to follow by putting everything in one place.
Wishing You All The Best in Your Investing Endeavors!
The Front Range Trading Team
NOT INVESTMENT ADVICE. The analysis and information in this report and on our website is for informational purposes only. No part of the material presented in this report or on our websites is intended as an investment recommendation or investment advice. Neither the information nor any opinion expressed nor any Portfolio constitutes a solicitation to purchase or sell securities or any investment program. The opinions and forecasts expressed are those of the editors and may not actually come to pass. The opinions and viewpoints regarding the future of the markets should not be construed as recommendations of any specific security nor specific investment advice. Investors should always consult an investment professional before making any investment.
Recent free content from FrontRange Trading Co.
-
 The Lines In The Sand Are Clear
— 9/16/20
The Lines In The Sand Are Clear
— 9/16/20
-
The Question of the Day
— 8/04/20
-
Portfolio Update: 1.23.20
— 1/23/20
-
State of the Markets: Modeling 2020 Expectations (Just For Fun)
— 1/13/20
-
Current Holdings for ALL-NEW 2020 Daily Decision Model Portfolio
— 1/03/20
